

/* Hello. I'm Bryan, a senior at Cornell University majoring in computer
science and minoring in business. I enjoy coding and learning hands on,
among other things. In a field as broad as computer science, the most
important skill is being able to adapt and learn, which is why I have
taken on a diverse range of projects. While I look to commonly used
models and examples to learn from, I always try to experiment and be
creative.
See below: */
//projects
//among other things
//contact

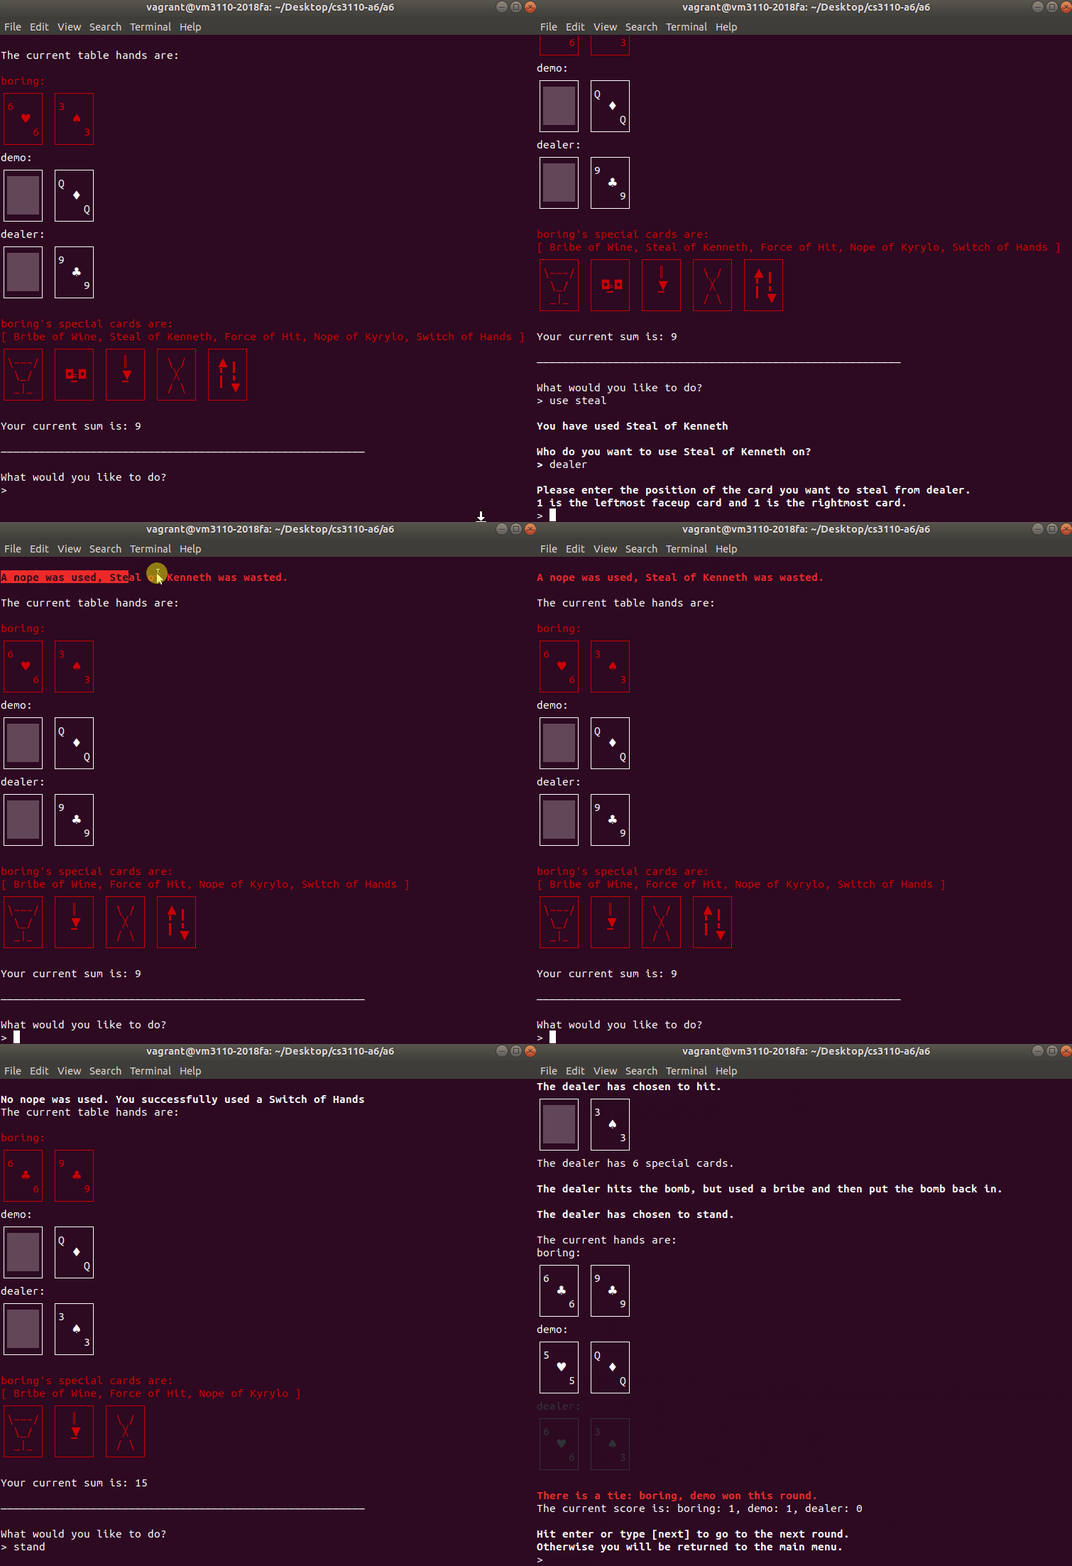
Exploding BlackJack is a combination of BlackJack and Exploding
Kittens. The game supports a reguar BlackJack mode, saving/loading
games, multiplayer and an ai called dealer. The ai can effectively
use all number and special cards. Players can choose which mode to
play when starting a new game. Exploding BlackJack contains extra
cards such as:
•bomb when drawn, the player loses the round
•defuse negates bomb cards and allows player to reinsert
bomb at specific location
•force hit forces next player to draw from deck
•nope can negate other players' cards
•switch hands switches user's hands with another player's
hand
•shuffle shuffles the deck
•steal user can steal another player's cards
•forsee allows user to see next three cards in the deck
Software Engineering Class Project (team of 8)
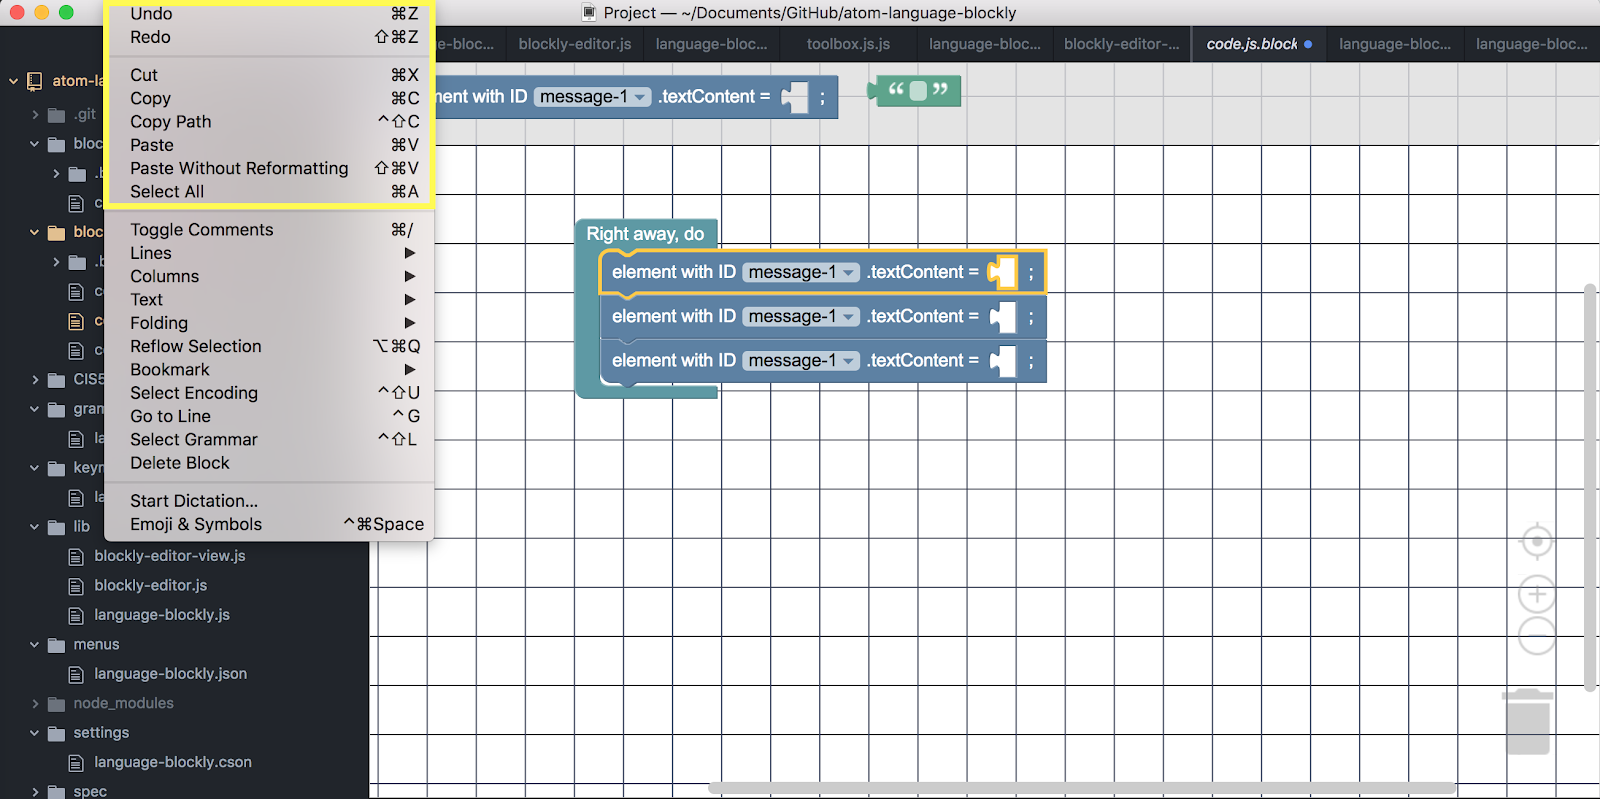
•Developed Atom Blockly plugin, to be used in an intro web
development class, with ReactJS
•Integrated Google's Blockly api with Atom text editor
•Developed in Agile/Scrum environment with a feasibility report
and a milestone report after each sprint (~25 days)
•Displays .blockly files with Blockly gui
•Copy, paste, redo, undo functionality for blocks
•Can translate blocks into code See less
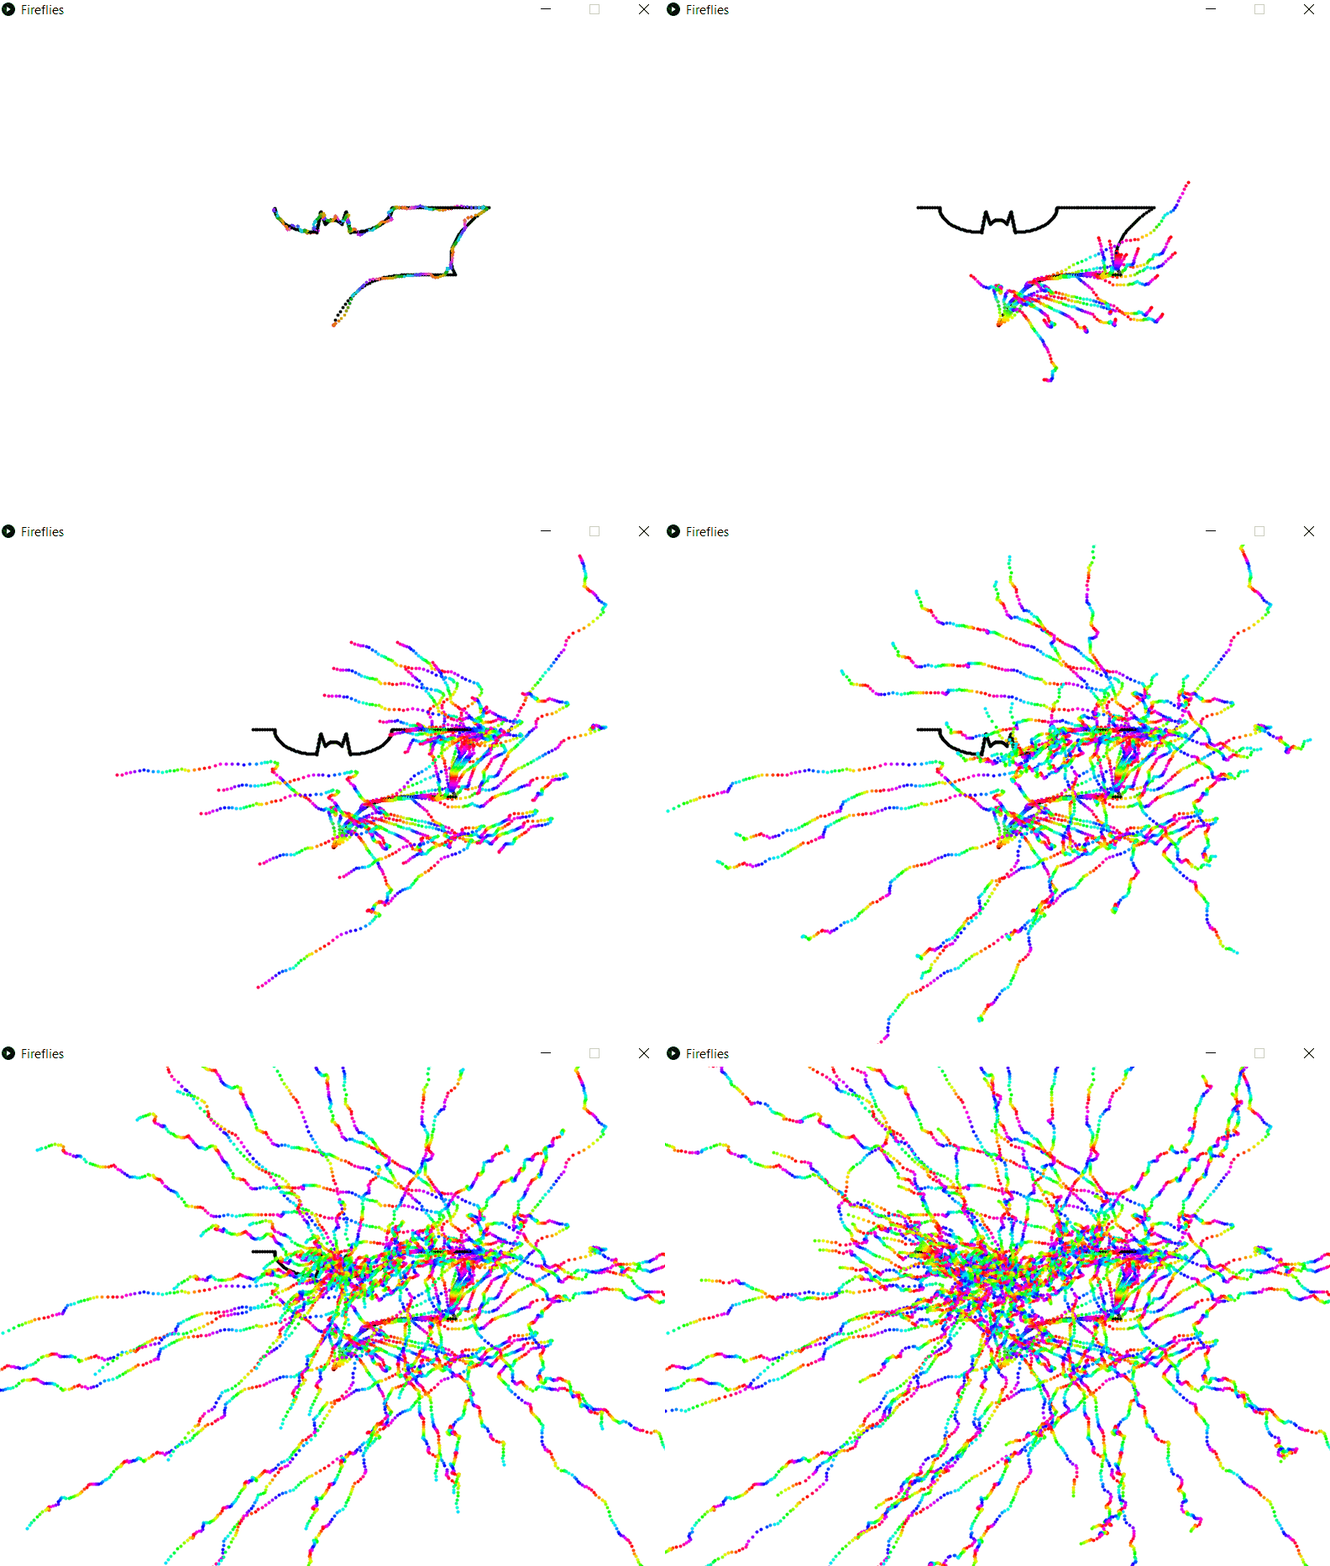
Was developed with four other peers as a final project for an AI
practicum. The GUI on the right shows the genetic algorithm in
progress. The goal of the algorithm is to be able to learn how to
trace a given symbol such the batman logo. The algorithm generates
many "fireflies" that are given random/semi-random directions.
Users can toggle between showing every firefly or just the most
accurate firefly.
The logo is a graph of time and each x,y coordinate of the logo
corresponds to a specific point in time. The lifetime cycle of
each generation is gradually increased to improve accuracy while
tracing the graph. The GUI shows the algorithm at a point in time
where the lifecycle time is about three quarters of the logo.
Fitness is a cumulative score based off of how far the firefly is
from the x,y coordinate corresponding to the current time. The
next generation of fireflies are created by randomly mixing the
directions of the most fit fireflies. There is also a mutation
rate that will randomly change some of the fireflies' directions
to reduce the chance of settling at a local maximum.
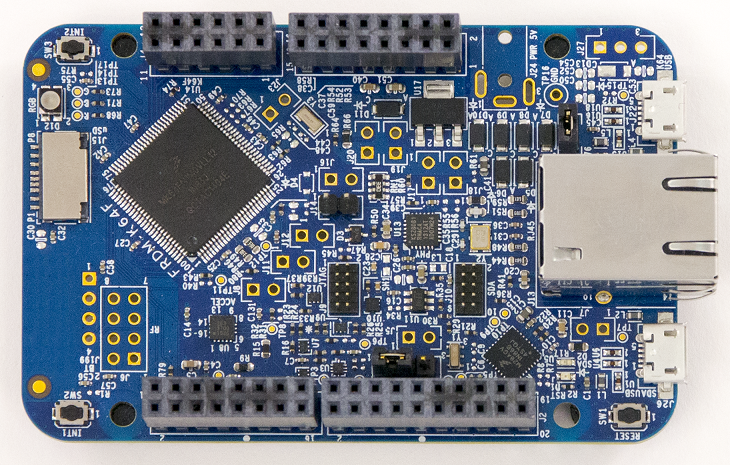
Active Simon is a game in which the user has to memorize a random
sequence of moves and replay them. Moves are represented by
different colored lights. The player has 3 lives and each level
has a time limit and an increase in difficulty (more moves to
remember) The game uses the FRDM-K64F board(shown in picture) and
its built in accelerometer.
Moves include:
•tilting the board forwards, backwards, left or right
•shaking the board
•front two buttons on the board
Demo:
https://youtu.be/smpL9WqD4Q0
(or click on icon for laptops)
I have developed and published two amazon alexa apps, Odds Are and
Goal of the Day.
Odds Are is a game in which when given a range, let's say from 1
to 999, will count down from 3 and then say a random number
between the given range. Has had 116+ unique users
Goal of the Day gives users a new 'goal of the day' each day to
accomplish. Has had 291+ unique users.

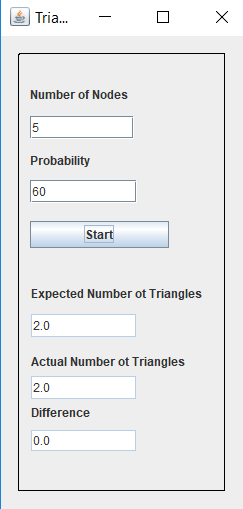
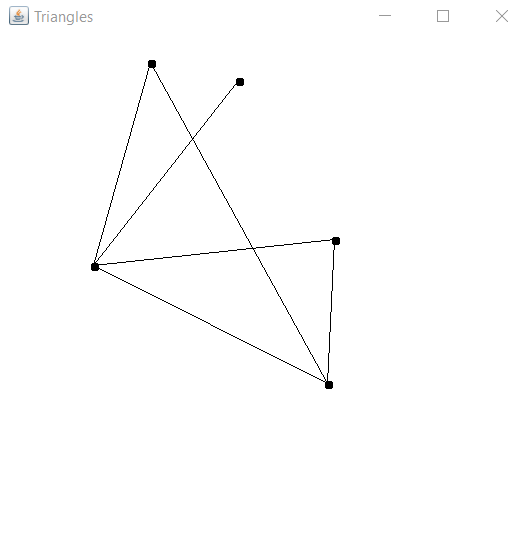
When given numerical inputs, n and p, the program will create a
random diagram that fullfills the following requirements:
1) There are n nodes
2) Each pair of nodes has p percent of forming an edge between
them
The graphical interface then returns the expected number of
triangles that will form, the actual number of triangles formed,
and the difference between the two values.
I was curious about the answer to a homework problem so I decided
to model it through Java. This project was coded from scratch on
my own time. I also wrote a python script to calculate the average
difference between expected and actual values for 1000 trials(see:
Python). The graph was more so to manually check if the algorithm
was correct.
I coded and designed this website with the help of Bootstrap and jQuery. It is mobile and tablet compatible. More details of my projects and website can be found on my GitHub page, linked in the contact section.
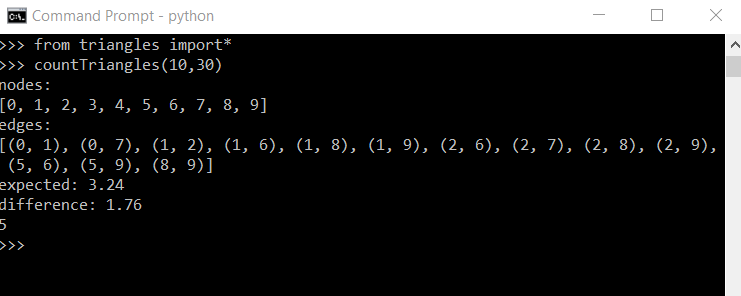
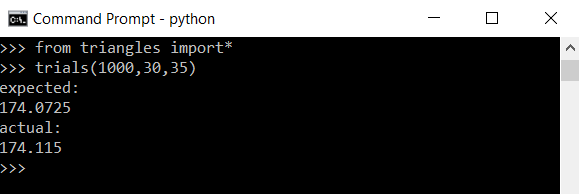
The python script models the problem described in JAVA-GUI. The
picture on the top models an instance of a particular diagram and
returns the number of triangles formed.
In the bottom picture, the trials method runs the countTriangle
method 1000 times, with each diagram having 30 nodes and 35
percent chance of forming an edge between any two nodes, and
returns the average number of triangles that actually formed as
well as the expected number of triangles to form.
I enjoy going for runs, hiking, basketball, tennis, handball, and other sports. I also play guitar and trombone. Whether it's playing an instrument or moving around, usually anything active that doesn't involve staring at a screen helps me clear my thoughts and stay focused afterwards.